
by Brendon Mikula
Physics is, to a first order approximation, the math of how the physical world works. It is a class that many struggle with. Those of you who have taken physics may have found yourselves sitting in class confused, wishing this whole physics thing made more sense. Well, your wishes are being answered by Physics Education Research (PER).
In PER, researchers use scientific principles to test and make conclusions about how students learn physics, as well as how physics is best taught. Given how scientific physicists generally are, you’d be surprised how long it took them to start applying the scientific process to their own teaching! PER research comes in many flavors and is conducted with students anywhere from middle school to graduate school.
This research is where I come in. I have always had a passion for figuring out how the world works, so I got my bachelors degree in physics. Many of the teachers in my own education were an inspiration to me and my learning, and I would love to do the same for others, so PER seemed like a perfect place for me.
To give you an idea of what Physics Education researchers do, I’ll walk you through one of my favorite projects. One of the benefits of education research is the ability to collaborate with people in other fields, and this project is focused on engineering students.
The first step of any education research is to find a research question to ask or to choose a student difficulty to address. Research by a previous student in my group had discovered—much to the surprise and dismay of professors in engineering—that introductory engineering students struggle with basic skills that are essential to becoming an engineer. An example of the skills mentioned is being able to read values off of a logarithmic scale. Logarithmic scales are a lot like linear scales with one big difference: instead of each step up the number line adding a constant amount (i.e., 1, 2, 3, 4…), each step up the number line multiplies by a constant amount (i.e., 1, 10, 100, 1000…). Logarithmic scales are useful for many reasons, one of which is being able to represent a wide range of numbers on the same scale and still be able to see what’s happening. This turns out to be especially important for engineers.

Log scales comic courtesy of xkcd.
By looking at assessments students had taken, we were able to deduce some of the reasons they were struggling. Namely, students were treating logarithmic scales as though they were linear. The question then became how to best go about correcting these errors. To that end, the Essential Skills Quizzes (ESQ) were developed.
The making of the ESQ began with a tedious process that involved playing in MS Paint and making images for problems to test students on their knowledge of logarithmic scales.
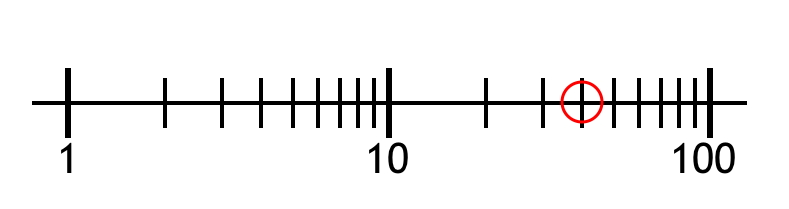
This is a simple picture of a log scale image I made using MS Paint.
Once the images were finished, the quizzes themselves were constructed. But we didn’t just make up things we thought would help, we based our training quizzes on the theory of mastery learning, which is supported by years of education research. Mastery learning means letting students take as much—or as little—time as they needed to learn the skills, but requiring each student to “master” the subject before moving on. For the ESQ, students could take the quizzes as many times as they wanted, but needed to score 80% or better for full credit. After each attempt, students were shown the correct answers to the questions so they could self-correct their errors. Each quiz covered a different set of topics and, once the quizzes were created, we began giving them to engineering students as part of their class.
But simply assigning the quizzes is no guarantee that they will help the students understand, nor is it good science. We need some way to measure what, if anything, the students are learning. We designed an assessment to test the knowledge contained in the ESQ, and gave this to the students both before (pretest) and after (posttest) the ESQ. If there was a change in scores between these two identical tests, it is most likely a result of the training.
Once the data had been collected, it was my turn to code it. This involved looking through all of the student responses (both to training, as well as the pretest and posttest) and recording various things about the students’ answers. We are interested not only in whether the students were right or wrong, but exactly how students were wrong. In this sense and others, coding data is much more than just “grading a test.”
After coding, we then analyzed the data using the powers of statistics. As it turns out, students performed drastically better on questions interpreting and reading logarithmic scales! We believe this success has come from 1) forcing students to repeat the test until they “master” the material before obtaining full credit and 2) allowing students to correct their own errors, rather than just telling them the right way to do things.
“Success! Case closed! Time for a new project!” you may say. But this is science, and the process never truly concludes, but rather it begins anew. Conclusions from the last round of research will raise new questions that had not been considered before, and new studies must be designed to answer these new questions and continue to improve what is already known. The life of a scientist is nothing if not cyclical, and there is always more to discover.
After the term ended, we met once again with engineering professors to discuss how the quizzes could be improved and what new knowledge we could include. This process is best shown by student responses to a survey about the ESQ. The blue graphs show the results from the first term of the ESQ, and the green/red graphs are the following two terms. The left column shows how much students enjoyed the ESQ, the middle column shows how much students thought they learned from the ESQ, and the right column shows how strongly the students recommend keeping the ESQ as part of the course. These graphs shows that the ESQ have 1) become more enjoyable for the students, 2) taught the students more, and 3) become a valuable piece of the engineering curriculum, all as a result of continued improvements.

Success!
I’m happy to say that the ESQ are as effective as ever, and they continue to improve. It brings me joy to know that I’ve helped students to understand things in the same way my teachers helped me. I may not see the students directly, but the things they learned from the ESQ will be useful for the rest of their careers.
If you are looking for more information, you can check out the American Association of Physics Teachers, which is our primary research conference/organization, or Physical Review Special Topics – Physics Education Research, which is the part of the American Physical Society that publishes PER findings.
________________________________________________________________
About Brendon Mikula
 I graduated from Michigan State University in 2010 with a BS in Lyman Briggs Physics. While in Lyman Briggs, I worked as an Learning Assistant (undergraduate TA) for the laboratory portion of the Lyman Briggs physics course. I received the “Outstanding LA Award” for Physics in Fall 2009. I now work in Physics Education Research under Dr. Andrew Heckler, primarily studying the use of computers as learning tools. In addition to studying student understanding of vector algebra in Physics students, I also participate in two interdisciplinary projects: investigating student understanding of log plot interpretation (and other “essential skills”) in Materials Science Engineering students, and using a computer-based farming game to help Geography students better understand the Green Revolution. My hobbies and interests include skiing, billiards, disc golf, darts and other games. I love spending time outdoors and with friends, family, and my girlfriend. Oh, and I’m a die-hard, bleed-green Michigan State fan (sorry, Buckeyes).


